
Financial reporting · Data Needs Analysis
Plenty of figures. Yet the meeting is about which one is correct.
"Is this figure even correct?" It sounds like an innocent question. Until the leadership meeting stops being about decisions and turns into a debate about which revenue figure is actually right.
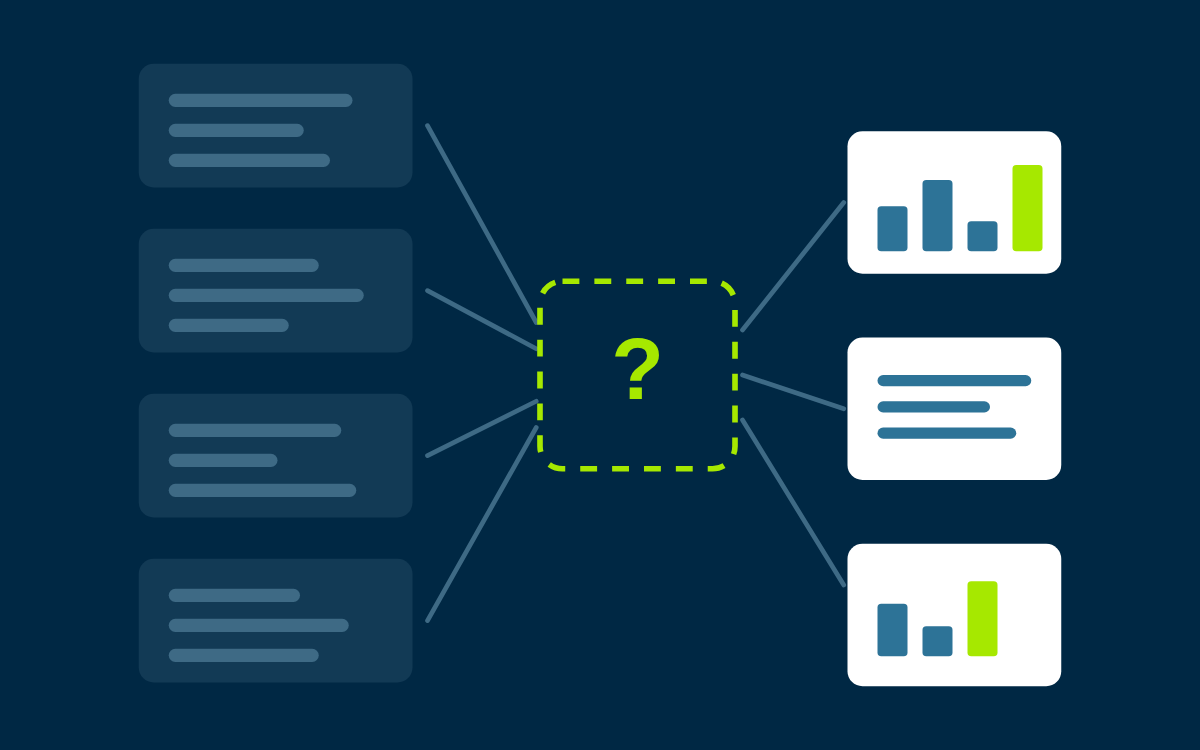
Finance looks at the bookkeeping. Sales looks at invoiced revenue or the order book. Someone pulls up an Excel file that was also used last month. Each figure can be correct from its own angle, they just are not always talking about the same thing.
You see this mostly in businesses that have grown. A new system came in, an extra legal entity or site, a new way of reporting. None of that is a problem by itself. It is just that the shared basis under those figures rarely grows along on its own.
Then a monthly report gets rebuilt from scratch every month. Margin per customer or product group takes manual work. And whoever pulls it all together had better not take leave in the week of the monthly close.
The problem rarely sits in one system
ERP, bookkeeping, CRM, planning and Excel each do their own job. There is nothing wrong with that either.
It starts to grind when the same customer has a different code in two systems, when nobody remembers which report is for what any more, or when "revenue" means something different to one team than to another.
A new dashboard or a new data warehouse can certainly be part of the solution. It is just not the first question.
The first question is: what information do we actually need to steer the business well?
Get the questions sharp first
That is the starting point of a Data Needs Analysis, or DNA for short.
Not starting from the data that is available today but from the decisions leadership and teams need to make in the months ahead. What information do they need for that? Where does it come from today? Which definitions do we use? And where is the gap between what someone wants to know and what is actually available?
We start by talking to leadership. Not about tables or tools but about the important decisions coming up and the information that is missing for them today.
Then we talk to finance, sales and middle management. Which reports do they use? Which questions keep coming back? And how much work goes into collecting, checking and explaining the figures?
Finally we look with IT and the people who know the systems at how the data actually flows today, from the source system to the report. Not to build something right away but to see what is reliable, what is missing and where it gets needlessly complicated.
No report for the drawer
A DNA is deliberately scoped.
No hundred-page academic report and no trajectory that already pushes a tool or technology forward. Instead a concise two to three page memo with the main pain points, prioritised by impact and effort, plus a three-step action plan.
Something you can act on come Monday.
Sometimes it turns out that a few definitions and agreements already bring a lot of calm. Sometimes there is a need for different reporting or a better link between systems. And sometimes a bigger data or ERP project genuinely makes sense. Either way, you at least know why.
Does this sound familiar?
I built a short test with nineteen statements about how figures and reporting come about in your organisation.
Tick what applies and you see straight away where you stand. No form upfront, anonymous, and done in two minutes.
About Roel Bäumer
Eighteen years in data and BI by now, with medium to large businesses. With Insitely I combine a reusable financial data layer with implementation and M&A data expertise. Where a file calls for extra analysis or bespoke work, I can also join an existing deal team as a data specialist.
More about Roel Bäumer.